
Decoding the Technical Components
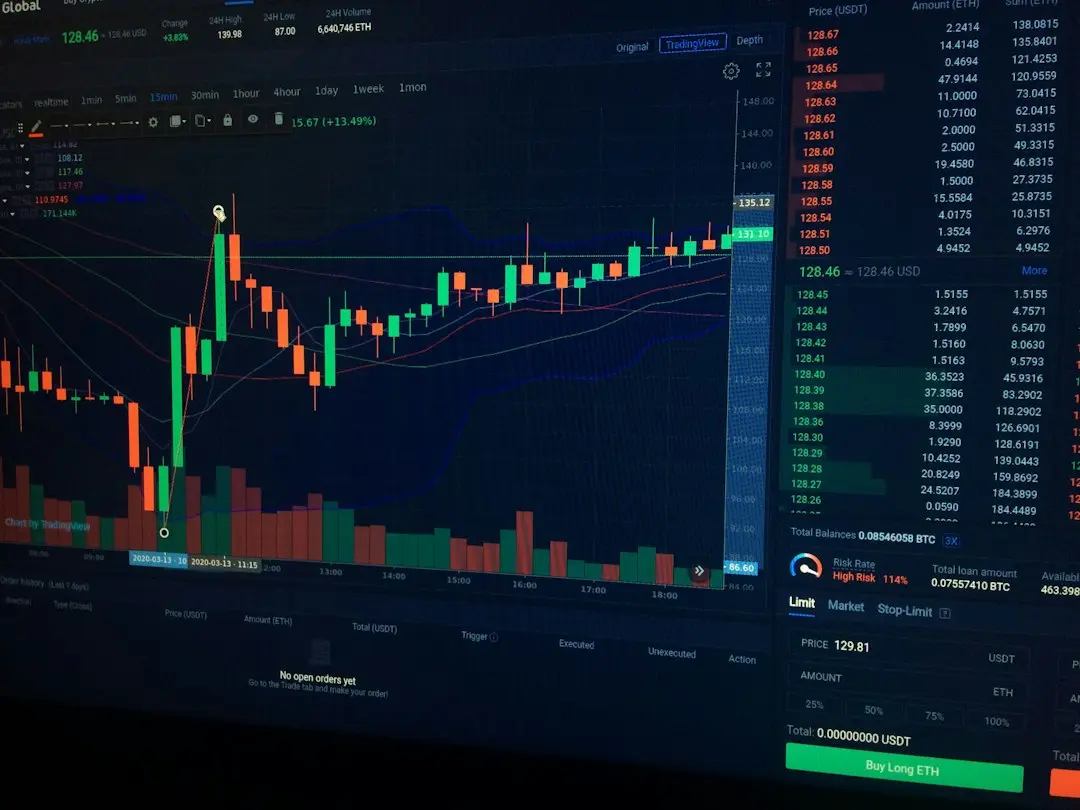
The Moving Average Convergence Divergence, or MACD, serves as a primary momentum tool for digital asset traders globally. Despite its widespread adoption in the volatile crypto market, many participants rely solely on basic crossover signals. Mastering this technical indicator requires a deeper understanding of its three core components to improve decision-making.
Breaking news
 Bitcoin Drops Below $82,000 After Hot US Inflation Data
 Kraken Parent Payward Acquires Saldo Bank for European Expansion
 UK Trader Sues BitMEX Over 1,053 Losing Trades in £20 Million Claim
 EU Banking Regulator Seizes Direct Control of USDC Oversight
The MACD measures the relationship between two exponential moving averages of an asset's price. It consists of the MACD line, a signal line, and a histogram. Traders observe these elements to identify shifts in market momentum, potential trend reversals, or the strength of an ongoing price movement.
The MACD line reflects the difference between a short-term and a long-term moving average. When this line crosses above the signal line, it typically suggests bullish momentum is building. Conversely, a cross below the signal line often indicates that selling pressure is increasing.
Can MACD Predict Future Price Action?
The histogram provides a visual representation of the distance between the two lines. Larger bars indicate stronger momentum in either direction, while shrinking bars suggest a trend may be losing steam. By analyzing these fluctuations, traders can filter out market noise and focus on significant trend changes.
While the MACD is a powerful tool for analyzing historical price data, it is not a crystal ball. It is a lagging indicator, meaning it reflects past price activity rather than predicting future events with certainty. Relying exclusively on one signal can lead to false breakouts or missed opportunities.
Frequently Asked Questions
Experienced traders often combine the MACD with other forms of technical analysis, such as volume indicators or support and resistance levels. This multi-layered approach helps confirm signals and reduces the risk of trading based on incomplete data. Integrating the MACD into a broader strategy remains essential for navigating crypto volatility.
What is the primary function of the MACD? The MACD identifies changes in the strength, direction, and duration of a price trend. It helps traders spot potential entry and exit points based on momentum shifts.
Is the MACD reliable for short-term crypto trading? It is useful for identifying trends, but it should not be used in isolation. Traders should pair it with other indicators to confirm signals and manage risk effectively.