
Technical Indicators Versus Market Reality
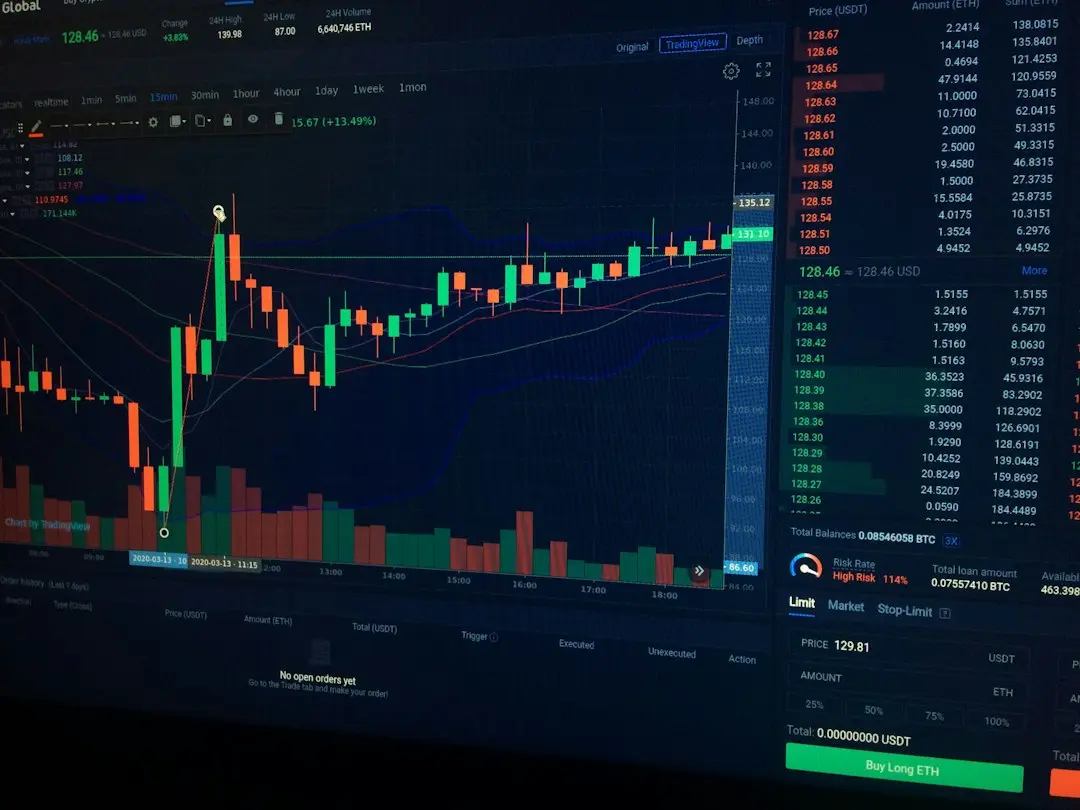
Bitcoin recently crossed above its 50-week moving average, a technical milestone that has historically signaled the end of bear markets. This price action occurred in late September 2026, drawing immediate attention from traders and analysts. The move suggests a potential shift in market sentiment, but experts caution that a single weekly close is insufficient to confirm a lasting trend reversal.
Breaking news
 Bitcoin Drops Below $82,000 After Hot US Inflation Data
 Kraken Parent Payward Acquires Saldo Bank for European Expansion
 UK Trader Sues BitMEX Over 1,053 Losing Trades in £20 Million Claim
 EU Banking Regulator Seizes Direct Control of USDC Oversight
The 50-week moving average serves as a critical support and resistance level for crypto assets. When Bitcoin trades below this line, it typically indicates a bearish environment. Conversely, moving above it often precedes significant rallies. However, historical data shows that false breakouts are common. Traders must wait for sustained momentum to validate the signal.
Analysts emphasize that technical indicators do not operate in isolation. The recent breakout coincides with broader market volatility and shifting institutional interest. While the chart pattern is bullish, fundamental factors remain complex. Regulatory developments and macroeconomic data continue to influence price discovery. Investors are closely watching volume levels to determine if the breakout has genuine backing.
Can One Weekly Close Define a New Era?
Some participants view the move as a definitive bottom, while others remain skeptical. Without a strong close above the level, the price could easily retrace. The current situation demands patience from long-term holders.
The core question remains whether this specific weekly close marks the start of a new bull cycle. Historically, Bitcoin has required multiple weeks above the 50-week average to establish a durable trend. Single-day spikes often fail to hold. Market makers are testing the new support level aggressively. If the price holds, it may attract more buy orders. If it fails, the bear market narrative persists.
Frequently Asked Questions
Data from recent trading sessions shows increased volatility around the moving average. This volatility is typical during trend transitions. Traders are adjusting their stop-loss orders accordingly. The psychological barrier of the 50-week line has been breached, but the battle for control continues. Institutional desks are monitoring on-chain metrics for additional clues.
Does breaking the 50-week average guarantee a bull market? No, it is a strong signal but not a guarantee. Historical patterns show that price must sustain levels above the average for several weeks to confirm a trend change.
What should investors do now? Investors should monitor weekly closes and volume. A confirmed close above the level strengthens the bullish case, while a rejection suggests caution is still required.