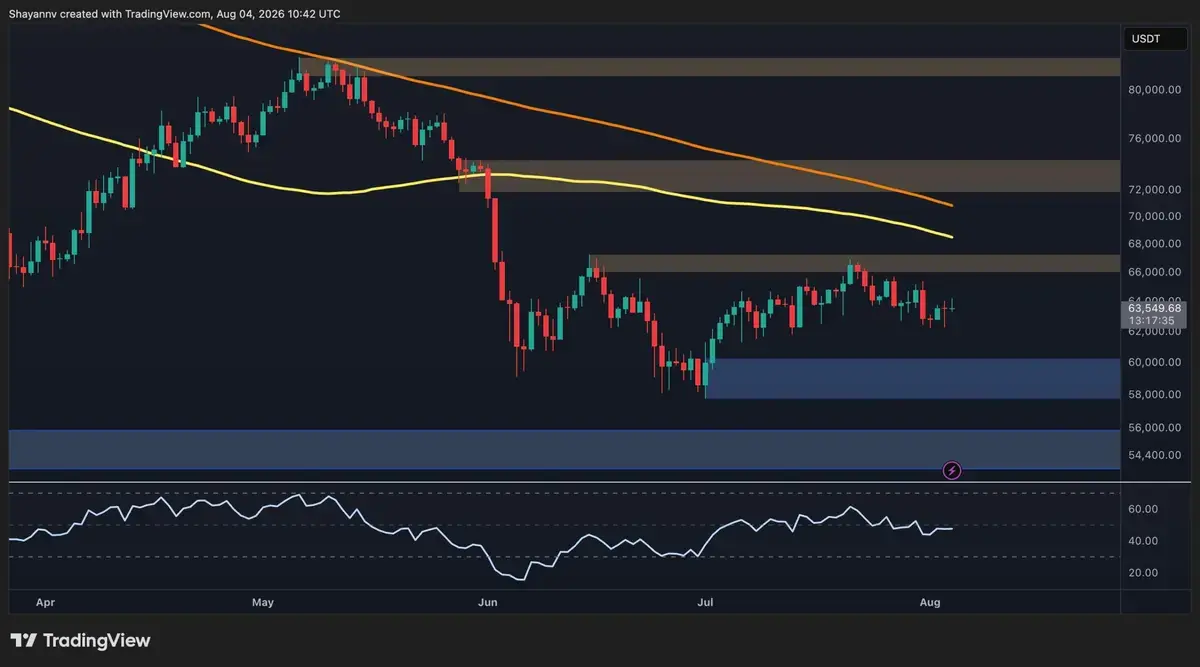
Technical Landscape: Key Levels and Indicators
Bitcoin is hovering inside a tight $62,000‑$66,000 band as of early August 2024. The cryptocurrency failed to break higher on Tuesday, prompting traders to watch the next candle closely. Market participants are eyeing the next 24‑hour window to gauge whether the digital asset can muster a breakout or settle into a deeper correction.
Breaking news
 Bitcoin Drops Below $82,000 After Hot US Inflation Data
 Kraken Parent Payward Acquires Saldo Bank for European Expansion
 UK Trader Sues BitMEX Over 1,053 Losing Trades in £20 Million Claim
 EU Banking Regulator Seizes Direct Control of USDC Oversight
The price action reflects a classic consolidation pattern after a volatile rally last month. Analysts point to diminishing buying pressure and a lack of fresh institutional inflows as reasons for the stalled advance. Meanwhile, the broader crypto market remains sensitive to U. S. monetary policy cues and emerging regulatory headlines, which could tip the balance either way.
The $66,000 ceiling aligns with the 50‑day exponential moving average, a resistance many traders monitor. A breach above this level would suggest bullish momentum and could attract short‑term speculators. Conversely, the $62,000 floor coincides with the 200‑day moving average, historically a strong support zone. Falling below it may trigger stop‑loss orders and deepen the sell‑off. Current RSI readings sit near 48, indicating neutral momentum, while MACD shows a narrowing gap that could foreshadow a directional shift.
Can Bitcoin Surge Past $66,000 This Week?
Volume has tapered off, hinting at reduced participation from large hands. Order book data reveals a modest sell wall near $66,200, while buy orders cluster around $61,800. These clusters suggest a tug‑of‑war that may resolve only after a catalyst, such as a major exchange listing or a policy announcement, provides clearer direction.
Some market strategists remain optimistic that a breakout is imminent. They cite a recent uptick in on‑chain activity, with transaction volumes rising 12% over the past week. Moreover, a handful of hedge funds have reportedly increased exposure to BTC futures, adding a potential demand boost. If these factors align, a short‑term rally could push the price above $66,000, at least temporarily.
Skeptics, however, warn that the broader risk‑off environment may suppress any upward thrust. Recent inflation data and higher‑for‑longer interest rates have made investors cautious across asset classes. Should the dollar continue to strengthen, Bitcoin could lose its appeal as an alternative store of value, slipping below the $62,000 threshold. In such a scenario, the next major support might be the $58,000 level, where previous lows have held.
The outcome will shape market sentiment for the coming month. A decisive breakout could reignite bullish narratives and attract fresh capital, while a breach of support may reinforce bearish expectations and trigger further downside pressure. Traders should monitor price action around the key levels and adjust risk management accordingly.
Frequently Asked Questions
What triggers a breakout above $66,000? A breakout typically requires a surge in buying volume, positive news such as regulatory clarity, or a shift in macro‑economic conditions that favor risk assets.
Is it safe to trade Bitcoin in this consolidation phase? Trading during consolidation can be risky due to tight ranges and sudden spikes. Using stop‑loss orders and limiting exposure are prudent strategies.
How does the $62,000 support relate to long‑term trends? The $62,000 area aligns with the 200‑day moving average, a historically strong support that often signals a longer‑term floor for Bitcoin prices.