How Do Liquidity Clusters Influence Bitcoin’s Short-Term Movement?
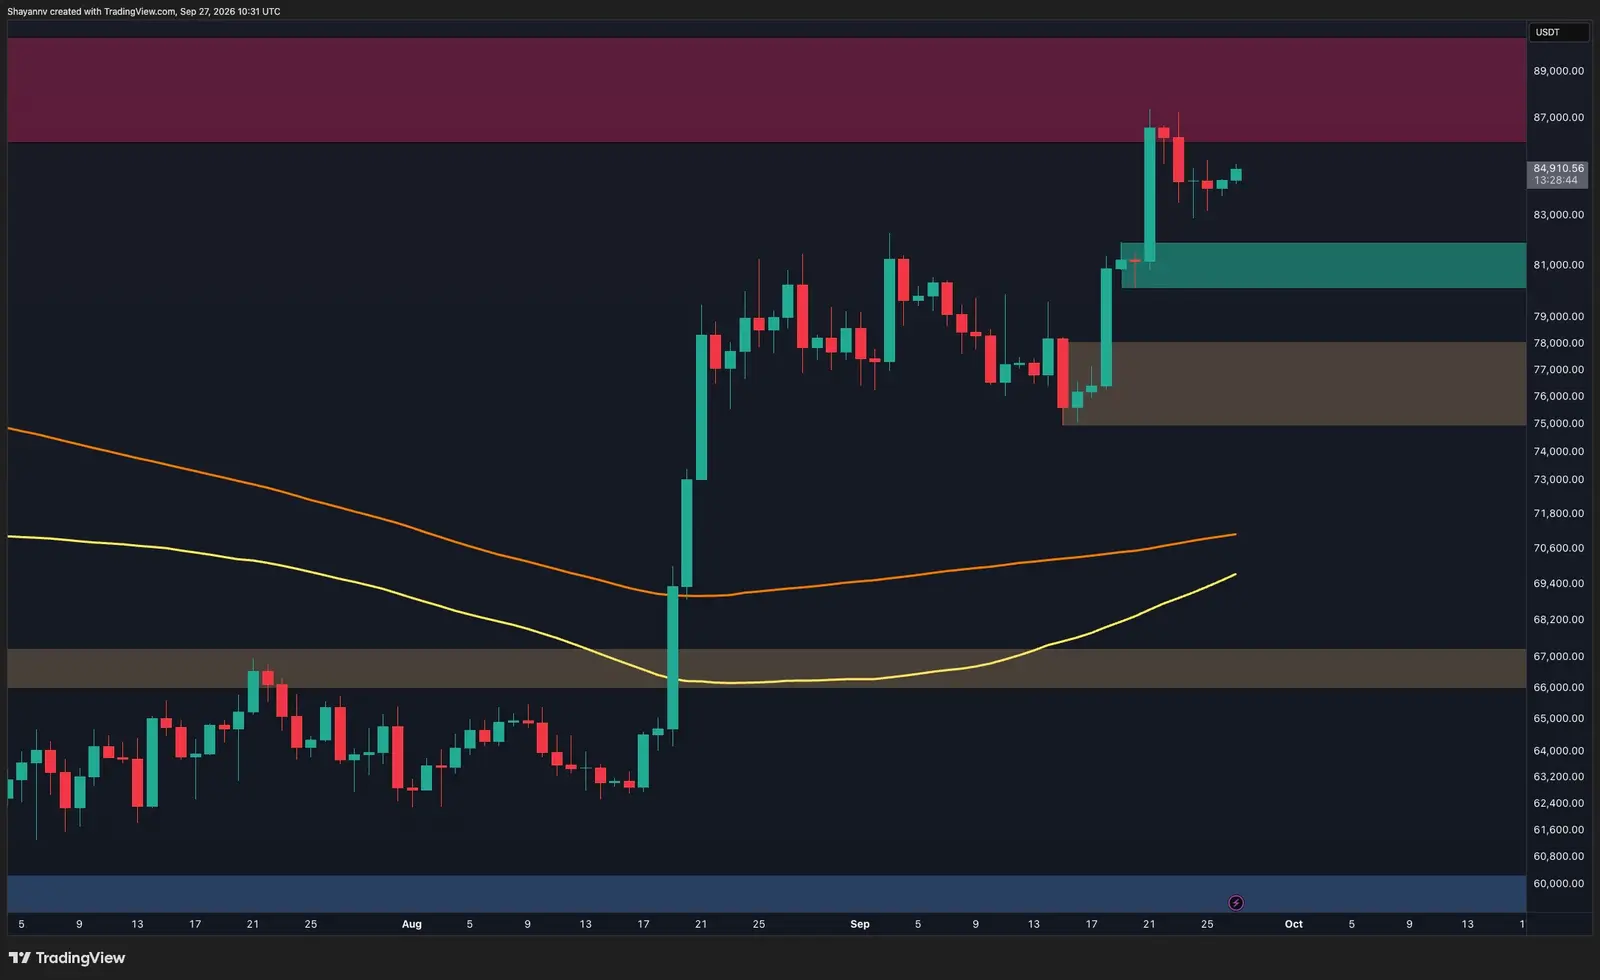
Bitcoin is attempting to recover after its latest rejection from the $86,000 to $87,300 supply zone, with traders closely monitoring price action for signs of renewed upward momentum. The cryptocurrency has struggled to break above this resistance area, which has acted as a significant barrier in recent sessions. Market participants are now focusing on key support levels and liquidity clusters that could determine the next directional move. This week’s price behavior will be critical in assessing whether buyers can regain control or if further downside pressure is likely.
Breaking news
 Investment Activity Surges in Global Cryptocurrency Markets
 Bitcoin Faces Resistance Near Record Highs as Crypto Infrastructure Recovers
 Wall Street Giant Predicts Bitcoin Surge as New Crypto Funds Enter the Market
 Sleeping Ethereum Giants Stir After Years of Silence
The $86,000-$87,300 range has emerged as a major supply area where selling pressure has consistently overwhelmed buying interest, leading to repeated rejections. Below this zone, traders are watching the $82,000 to $83,500 band as a critical support area where liquidity has accumulated, potentially offering a floor for any pullback. Additionally, the $79,000 to $80,500 range is being noted as a deeper liquidity cluster that could come into play if weaker hands are shaken out. These levels are derived from historical trading volume and order book data, indicating where large concentrations of buy or sell orders may reside. Liquidity clusters often act as magnets for price, drawing action toward them before a potential reversal or continuation.
What Happens If Bitcoin Fails to Hold Above $82,000?
Liquidity clusters form where significant trading activity has occurred, creating zones where price may accelerate due to clustered stop-loss orders or pending limit orders. In Bitcoin’s case, the $82,000-$83,500 support zone reflects past buying interest that could trigger a bounce if reached, while the lower $79,000-$80,500 area represents a deeper pool of liquidity that might attract price during a more aggressive correction. Traders use these zones to anticipate potential turning points, as price often reacts sharply when entering such areas due to the sudden execution of clustered orders. This week, a test of the $82,000 level could provide early insight into whether bulls are ready to defend the near-term structure.
A break below the $82,000 support zone would likely shift focus to the $79,000-$80,500 liquidity cluster as the next area of interest, potentially triggering increased selling pressure if stops are triggered beneath it. Such a move could open the door for a retest of lower weekly lows, weakening the short-term bullish bias. Conversely, a hold above $82,000 combined with a reclamation of the $86,000-$87,300 supply zone would signal renewed buyer strength and could set the stage for a challenge toward higher resistance. Market sentiment remains cautious, with volume and price action at these key levels serving as the primary indicators for the week’s outlook.
What is the current key resistance zone for Bitcoin? The current key resistance zone for Bitcoin is between $86,000 and $87,300, where the price has faced multiple rejections and struggled to break through despite recovery attempts.
Frequently Asked Questions
Why is the $82,000-$83,500 range considered important? This range is considered important because it represents a liquidity cluster where significant buying interest has accumulated in the past, potentially acting as support if the price pulls back from higher levels.
How might a break below $82,000 affect Bitcoin’s outlook? A break below $82,000 could shift focus to the lower $79,000-$80,500 liquidity zone, increasing the likelihood of further downside and testing weaker support levels if selling pressure intensifies.